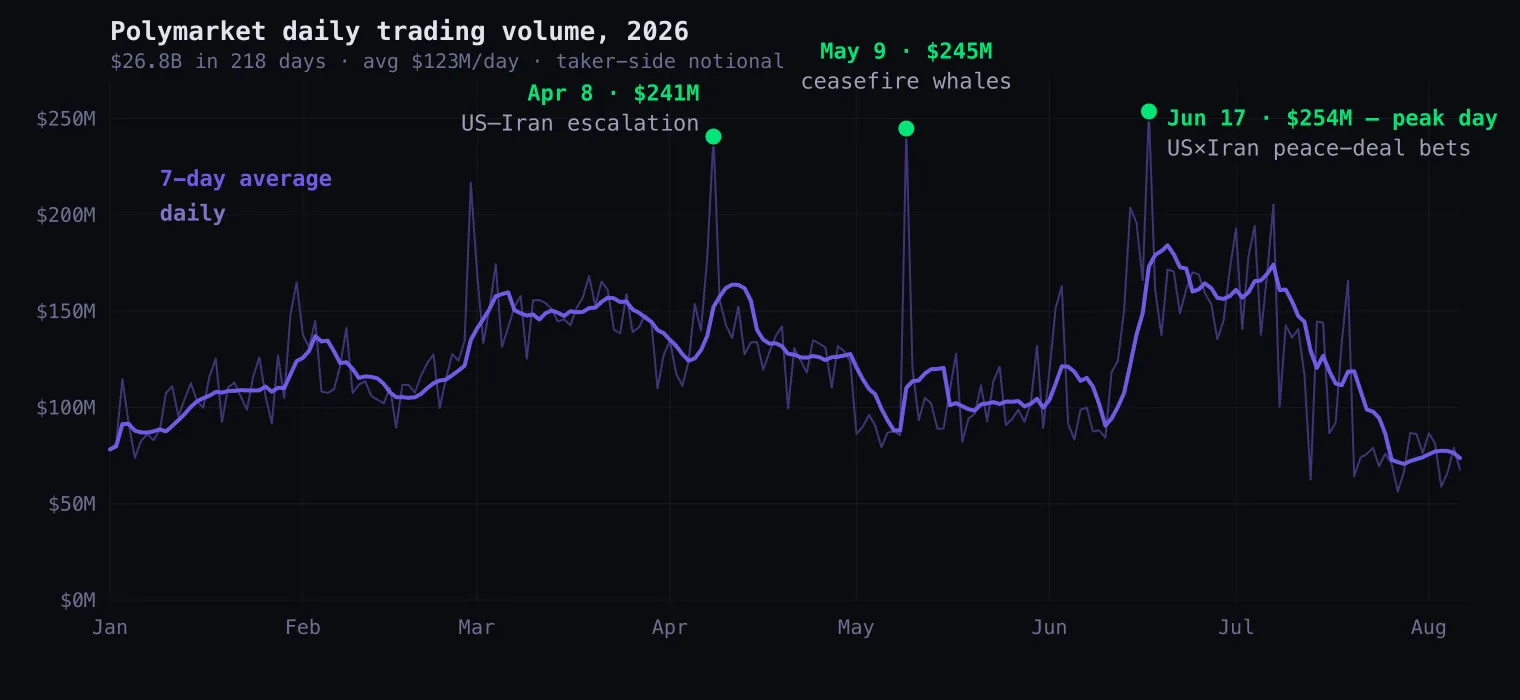
In the first 218 days of 2026, Polymarket traded $26.8 billion — an average of $123M every day, peaking at $254M on June 17. We computed every number in this post from our own node archive: every fill, every wallet, every market, no sampling. Here is what a year of prediction-market trading actually looks like — what drives it, what it trades, and who does the trading.
The shape of the year
The daily line tells the story at a glance. The floor sits near $80–100M on quiet days. The 7-day average climbed through a dense March (the peak month: $4.59B), sagged in early summer, then surged again as July’s sports season arrived. And piercing through the average: single-day spikes above $240M, every one of them a news event.
Monthly totals: Jan $3.26B · Feb $3.36B · Mar $4.59B · Apr $4.08B · May $3.19B · Jun $4.33B · Jul $3.57B.
Every 2026 peak was geopolitics
We pulled the top markets for each spike day, and one storyline dominates the entire year — the Iran arc: strikes → regime change → invasion → ceasefire → peace deal, recurring from February to June.
- Jan 31 — $165M: the US government-shutdown deadline ($22.4M on the shutdown market alone, 4.2k wallets).
- Feb 28 — $217M: “Khamenei out as Supreme Leader by Feb 28?” ($18.2M, 9.2k wallets) plus “US strikes Iran” variants.
- Apr 8 — $241M: “US forces enter Iran by April 30?” took $68.7M — 28.5% of the whole day — plus a ceasefire market at $32.1M. Two markets, ~42% of the platform.
- May 9 — $245M: “Russia×Ukraine ceasefire by May 31?” at $91.1M — 37.2% of the day from 1,100 wallets.
- Jun 17 — $254M, the year’s peak: “US×Iran permanent peace deal” markets, $67M+ combined, again on ~1.2k wallets.
Notice the two different spike shapes. February 28 was broad: nine thousand wallets piling into a deadline. May 9 and June 17 were narrow: tens of millions moved by roughly a thousand wallets — whale-driven days, where the size came from the heavy cohort, not the crowd. The biggest days of the year were the narrow kind.
Sports is the floor, war is the ceiling
Classify the identifiable event markets by category and a clean seasonal rotation appears:
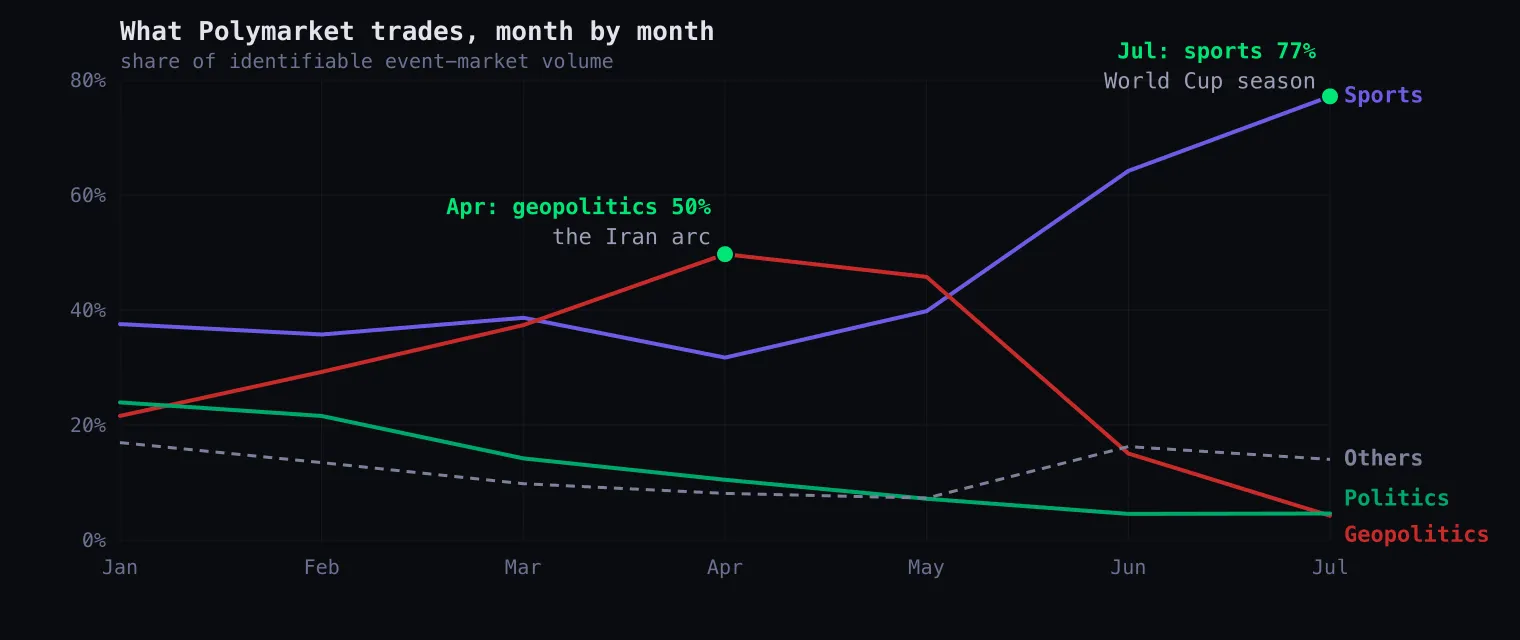
- Sports is the steady base — 32–40% of event-market volume all spring from constant game flow, then a summer takeover: 64% in June, 77% in July as the World Cup landed.
- Geopolitics drives the spikes — climbing from 22% in January to 50% of all event-market volume in April, the height of the Iran arc, before collapsing to 4% by July as the story resolved.
- Politics faded all year: 24% in January to 5% by summer — an off-cycle year with no election to feed it.
The pattern in one line: sports sets the volume floor; the news sets the ceiling. Overall, of the $10.2B we could confidently classify: Sports $4.87B (48%), Geopolitics $2.85B (28%), Politics $1.15B (11%), Crypto $0.73B (7%).
One honesty note on method: volume on Polymarket is spread across 2.6 million distinct assets, most of them auto-generated micro-markets (5-minute crypto up/downs, daily sports) that don’t resolve to clean categories. Our classification covers the top ~12k assets — $10.2B, about 38% of all volume — so the true Crypto and Sports shares are higher than shown, and the monthly trend is the robust part, not the absolute percentages.
Who does the trading: the 3.5%
Between 574k and 784k wallets traded in any given month (March was the year’s peak). But activity is a power law, and the top of it is stark:
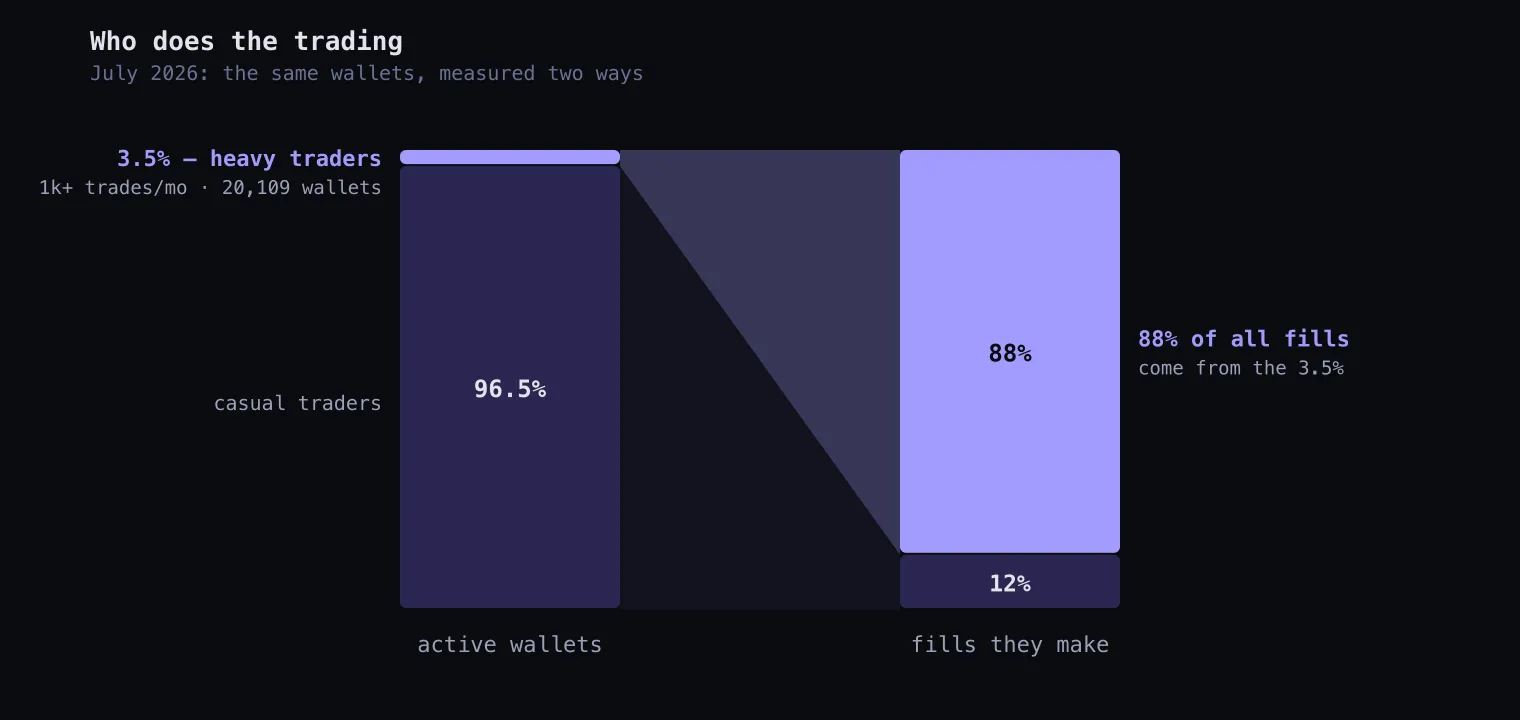
- Wallets making 1,000+ trades a month — market makers, bots, professional operations — are only 3–6% of active wallets, but they generate 86–90% of all fills, every single month.
- The other ~96% — three-quarters of them making fewer than 50 trades a month — move the wallet count, not the volume. July’s sports season pulled in the year’s biggest casual crowd (284k wallets making 1–5 trades) while total activity fell.
- Cross-reference the peak days: the year’s biggest single-day volumes came from ~1,100 wallets. The heavy cohort doesn’t just make the markets — it makes the news days too.
We have met members of this 3.5% throughout this series: the patient sweep-catcher, the resolution-proposing bots, the negative-risk harvesters. This is the cohort your orders trade against.
Where these numbers come from
Everything above is one SQL query over our own archive — 218 daily Parquet files built from a Polygon node recording every Polymarket fill with wallets and roles attached. Volume is taker-side notional (each fill counted once — the standard convention). No API sampling, no third-party dashboards, no estimates.
That archive is the offline twin of the live stream: the same attributed tape, either replayed for research like this or delivered in real time for trading. If your strategy needs to know what the 3.5% are doing — while they are doing it — that is exactly what the feed carries. And if you need the history behind a longer backtest, [email protected].