Every Polymarket wallet writes a story, one trade at a time — and if you collect those trades, you can read it: when they entered, when they added, when they took profit, and whether they do it the same way twice. That story, not a headline P/L number, is how you decide which wallets are worth following and what strategy they’re actually running.
Here’s the difference in one pair of pictures.
The profile tells you the outcome
Polymarket’s public profile for a wallet shows you the aggregates:
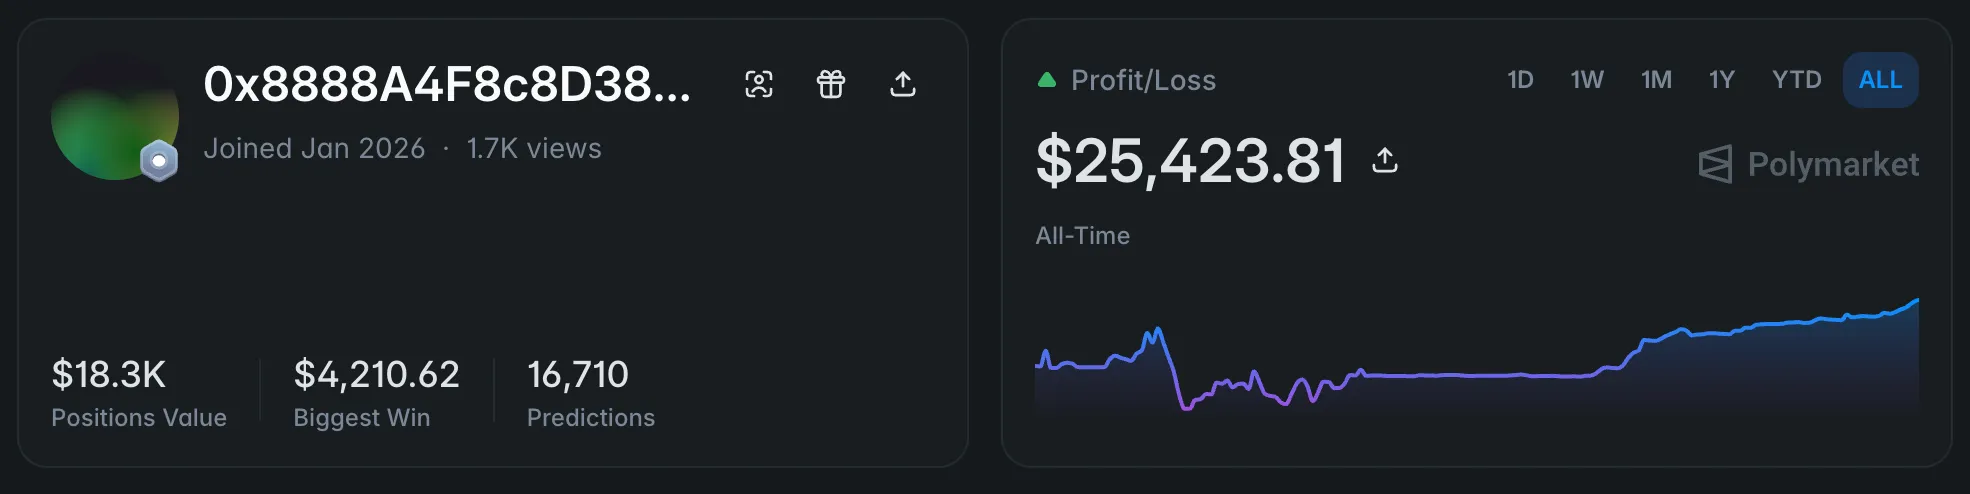
This wallet has made $25.4K all-time across 16,710 predictions, with $18.3K currently deployed. Genuinely useful — it tells you this account is active, sizeable, and net-profitable. What it can’t tell you is how. Is this a sharp directional trader? A market maker collecting spread across thousands of tiny fills? Did the equity curve climb steadily, or is it one lucky $4K win propping up noise? The flat parts and the jump in that P/L chart hint at regime changes — but aggregates can’t explain themselves.
If you’re choosing wallets to copy-trade, that distinction is everything. You don’t want to copy an outcome. You want to copy a process — which means you need to see it.
The history tells you the story
Now the same wallet, read at the trade level. We took one market — “Will WTI dip to $80 in July 2026?” — pulled every trade in it from the feed, and plotted one wallet’s activity against the price line:
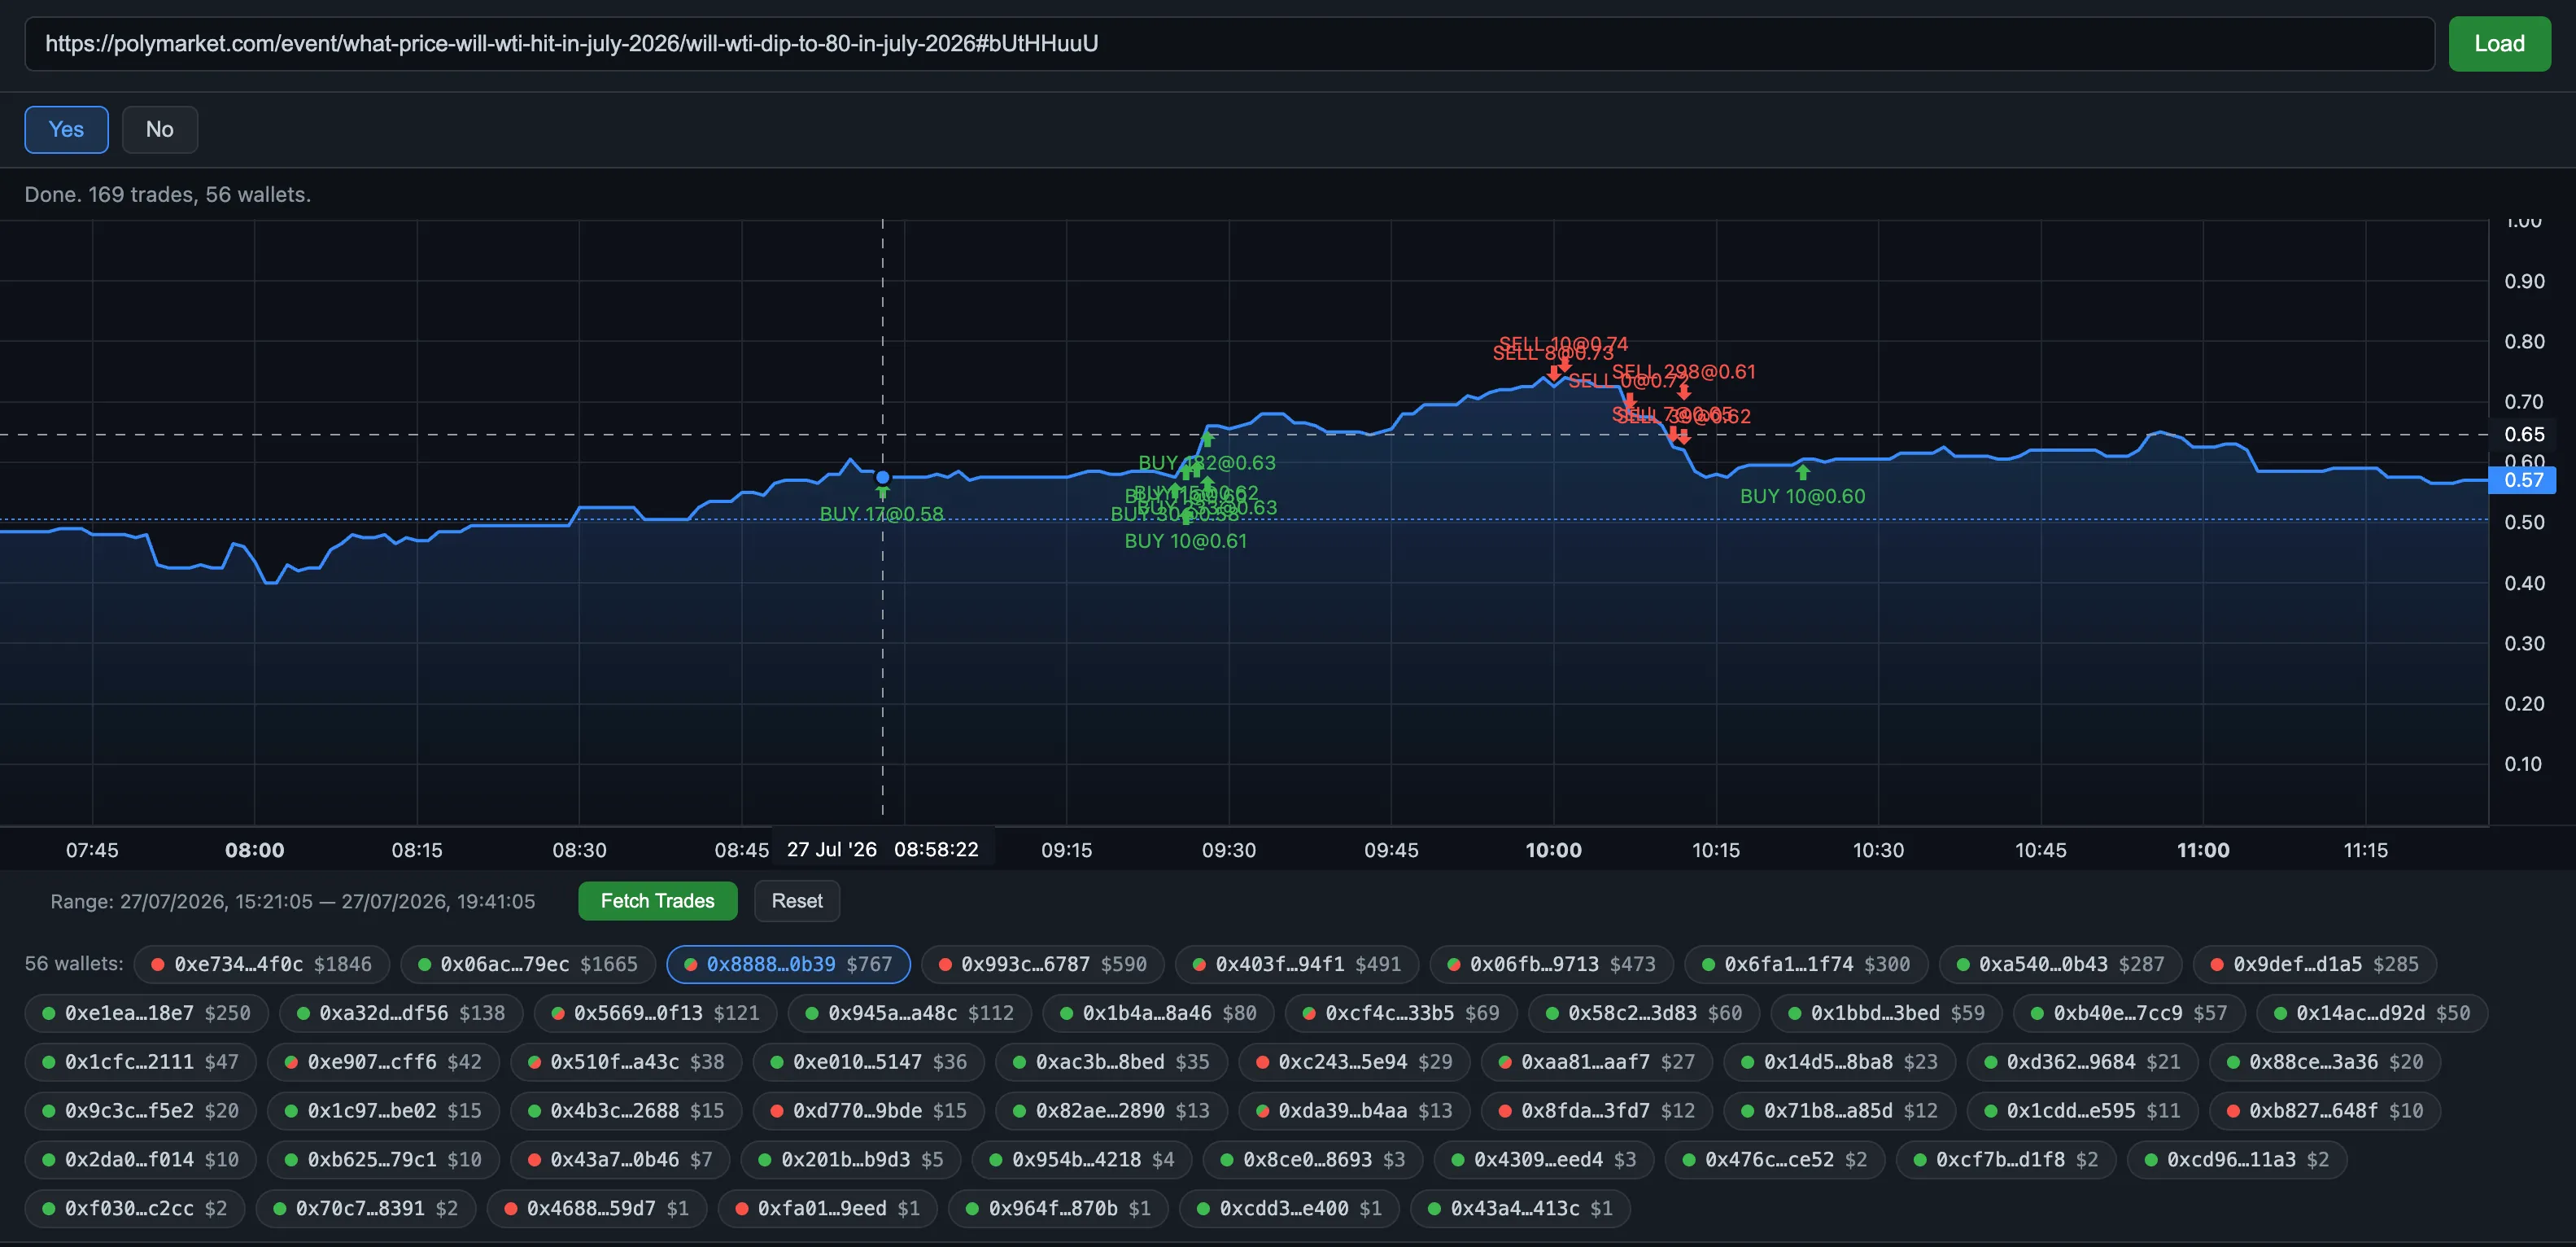
One four-hour window: 169 trades from 56 wallets, with our wallet (0x8888…0b39) highlighted. And suddenly there’s a narrative you can evaluate:
- Entry at 0.58 before the move, adding through 0.61–0.63 as the odds climbed;
- Profit-taking at 0.73–0.74 — near the local top, not after the retrace;
- After the drop, a small re-entry at 0.60 — the same thesis, re-established cheaper.
That’s a disciplined swing pattern: early entry, scale-in, sell into strength, reload on pullback. Whether you’d follow this wallet is now an informed judgment — and repeated across markets and weeks, the pattern (or its absence) becomes the answer. The same view instantly exposes other behaviors too: wallets buying every dip and never selling (conviction holders), wallets on both sides at tiny size all day (market makers — the maker/taker roles in the feed make this explicit), or wallets that always arrive after the move (momentum chasers you don’t want to be behind).
The view in that screenshot is a live product: Trades Inspector, available to every Polyflux subscriber. Paste any Polymarket market URL, chart the price, click-select a time window, and see every wallet that traded it — ranked by volume or P&L, with per-wallet breakdowns (bought, sold, average prices, realized and unrealized P&L, fees) and the full, exportable trade tape, every fill linked to its transaction. If you want to read a wallet’s story right now, without building anything, that’s the fastest way — it’s included in the 24-hour free trial.
If you’d rather build your own view — or need this data feeding a bot rather than a screen — the interface is not the hard part anymore. The data is. Which brings us to how you get it.
Building the dataset
Everything above is derived from the same trade events the stream already delivers — each one carrying wallet_address, asset_id, size, price, operation_type, and a millisecond timestamp. Collecting them is a loop and an append:
# pip install polyflux-client
import asyncio, json
from polyflux import Client

async def main():
    client = Client("YOUR_API_KEY")
    with open("trades.jsonl", "a") as out:
        async for trade in client.trades():
            out.write(json.dumps(trade.raw) + "\n")

asyncio.run(main())
Leave it running and the dataset builds itself: every wallet, every market, timestamped to the millisecond. From there, analysis is a groupby(wallet_address) away — and the MarketCatalog turns each asset_id into a market name so your stories have titles. (If you’re also maintaining live positions from the same events, the snapshot + deltas pattern applies unchanged.)
Need history you weren’t around to record? Recording forward only gets you data from today. If your analysis needs the full trade record over a longer period — backtesting a wallet-selection rule, or reconstructing months of a specific wallet’s behavior — write to [email protected] and tell us the scope; we can arrange access to the complete Polymarket trade archive.
Reading like an analyst: what to look for
Once you can replay any wallet’s story, a few patterns separate signal from luck:
- Timing vs. the move — consistently early entries are an edge; consistently late ones are a warning, however profitable the profile looks.
- Exit discipline — does profit-taking happen into strength (like the 0.73–0.74 sells above), or only after giving gains back?
- Repeatability — the same shape across many markets is a strategy; one great market is an anecdote.
- Sizing — does size grow with conviction and shrink after losses, or is it erratic?
A wallet that passes those checks is a candidate worth following in real time. One that doesn’t — no matter its leaderboard rank — just taught you something cheaper than copying it would have.
Two ways to start reading wallets today: open Trades Inspector and inspect your first market in minutes — no code, included in the free trial — or grab a key and run the loop above so your own dataset is already growing. And for the archive going back further, [email protected].