Over four months, one Polymarket wallet built large “no war” positions, panic-sold everything it held — three separate times — and paid about $62,000 for it. Not because the wars happened. They didn’t, and both markets recovered within minutes of every dump. The money went to traders whose resting bids sat quietly below the market price, waiting for someone to blink.
The wallet
The account is “smallpig” (0xe8d6…d5db) — joined March 2026, 23 predictions, and today: zero open positions, a biggest win of $220.98, and a year-to-date P/L of −$65,201.
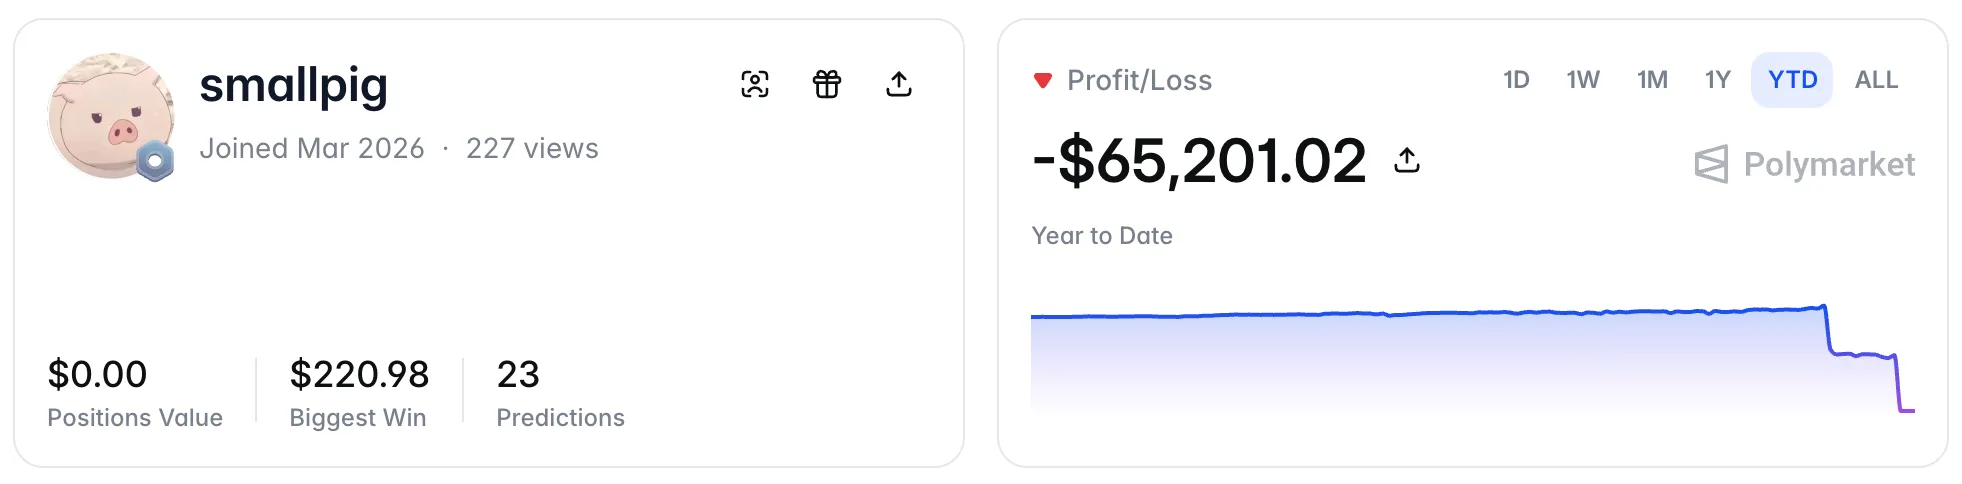
Long story short. Starting in late March 2026, smallpig built positions in two markets: “Will China invade Taiwan by December 31, 2027?” and “China x Japan military clash before 2027?” — always buying NO, at $0.82–$0.93 per share. The thesis: no war.
Then, several times, he sold the positions completely — all at once, sweeping whatever liquidity the order book had. Nothing had happened in reality, and the market restored itself minutes after each dump. So he bought back in shortly afterwards, at higher prices, losing some money each round. On July 30 he did it one final time: the entire position in both markets, market-sold within about a minute, locking in the losses. The market, as usual, recovered within the hour.
The story started with 131 deposits
Positions this size need funding, and the funding tells its own story. Over four months, this wallet received 131 deposits totaling about $577K — starting with a $1.90 test transfer and escalating from there (deposits are a leading indicator; this wallet is a textbook case):
| Month | Deposits | Total | Character |
|---|---|---|---|
| Apr 2026 | 3 | $3,264 | toe in the water ($1.90 test, then ~$1–2K) |
| May 2026 | 36 | $45,025 | steady small top-ups ($100–2.5K), first big one $13,656 (May 16) |
| Jun 2026 | 71 | $240,535 | ramp hard — many small + lumps: $73K (Jun 16), $18.7K, $50K (Jun 29), $40K (Jun 30) |
| Jul 2026 | 21 | $288,618 | fewer, bigger — the $184,675 whale deposit (Jul 19), $41K (Jul 2), then a heavy Jul 28–30 finish |
Now put those dates next to the trading. The panic exits were June 16 and July 19 — and the biggest deposits are $73K on June 16 and $184,675 on July 19. The same days. Each time he dumped his position at a loss, he didn’t walk away: he wired in more money, that day, and bought back in bigger. The deposits escalate exactly as the losses do.
The trading, replayed
We pulled every trade this wallet made from Polymarket’s public data API — the same per-wallet replay we described in reading a wallet’s story — and plotted his orders against each market’s price. Green circles are buy orders, red circles are sell orders, both sized by share count and placed at their average execution price. The green area below is the position itself. Hover any order for its details.
“Will China invade Taiwan by December 31, 2027?” — three full cycles. Note the two red clusters far below the price line: those are entire positions sold through a thin book.
“China x Japan military clash before 2027?” — same pattern, two cycles. The final sell order averaged $0.585, with fills as low as $0.291 — on shares trading at $0.92 an hour later.
What the urgency cost
Split the history into cycles — each one ends with the position back at zero — and the pattern is unmistakable:
| Market | Cycle | Bought | Avg buy | Avg sell | P&L |
|---|---|---|---|---|---|
| Taiwan invasion | Mar 21 → Jun 16 | 82,893 shares | $0.824 | $0.835 | +$922 |
| Taiwan invasion | Jun 16 → Jul 19 | 307,009 shares | $0.860 | $0.787 | −$22,351 |
| Taiwan invasion | Jul 19 → Jul 30 | 172,393 shares | $0.906 | $0.746 | −$27,712 |
| China × Japan | Apr 1 → Jul 19 | 12,998 shares | $0.894 | $0.911 | +$219 |
| China × Japan | Jul 19 → Jul 30 | 37,444 shares | $0.930 | $0.585 | −$12,941 |
The first cycles — exited calmly, in normal-sized orders at market prices — were roughly breakeven. Every dollar of the −$61.9K total came from the two panic days, July 19 and July 30, when the exits went through as immediate market sells. The order books simply didn’t have enough resting bids near the price, so the fills walked down: to $0.44 on July 19, to $0.51 and $0.29 on July 30.
And here is the detail that turns this from bad luck into a lesson: the market itself barely moved. On July 30, the Taiwan market’s NO price dipped from $0.88 to $0.825 — the dip was his selling — and was back at $0.865 within the hour. He didn’t sell a crash. He caused a dip, sold into it, and watched it heal without him.
What was that?
We can only guess. Did he believe he had inside information that kept almost proving true? Was he trying to shake the market? Nobody knows — on-chain data shows structure, not intent. What is known for sure: dozens of other traders had buy orders resting below the market, and when the price fell through them, they were filled at a discount by a seller who couldn’t wait. That is where the $62K went — not to the market, but to the patient side of it.
Finding who he sold to — with Trades Inspector
The counterparties are not a mystery. They are on the tape, and Trades Inspector replays it in a couple of clicks: paste the market’s URL, load the price chart, select the minutes around the dump — and every wallet that traded inside that window appears, ranked by volume and P&L, with each fill listed. The wallets at the top of the buy side are the ones who caught smallpig’s shares at a discount. Here is the whole lookup, done on the China × Japan market in under a minute:
Every wallet in that list links straight to its Polymarket profile and Polygonscan — so “who profited from the panic” goes from a rhetorical question to a clickable list.
This happens every day
Nothing about this wallet is unique except that we looked. Forced sellers, panicked exits, and oversized market orders sweep thin books on Polymarket daily, across every category of market — and each one is a transfer from whoever is urgent to whoever is ready.
Being ready is a strategy of its own, and it has two halves: seeing the dump the moment it starts, and knowing where to catch it. The Polyflux stream delivers every trade from the mempool, ~3 seconds before it confirms — a cascade of six-figure sells inside a minute is about as loud as an on-chain signal gets. And Trades Inspector lets you replay any market’s tape afterward and see exactly who caught the falling knives, at what prices, fill by fill.
In the next post we’ll break down that strategy — how the patient side of a panic actually positions itself, and how to run it on the live feed. If you want to be ready before then: grab a key and start watching the tape.